Predicting School GCSE grades
Every year, the UK government releases a comprehensive dataset showing average GCSE grades at each school alongside demographic information about the schools. You can download the data yourself here.
For obvious anonymity reasons, the government don’t provide the grades of individual students. Nonetheless, it’s a fascinating dataset that can be used to look at the relationship between different demographic variables and educational achievement, as well as to track changes in GCSE results overtime.
When the 2018-19 GCSE data became available in a couple of months ago, I’d been planning to take a look at the data primarily to explore how things like school size, school type and economic background of the students affect GCSE grades.
Although I’m still going to be doing that here, with the rise of the COVID-19 pandemic, and resulting school closures, the dataset has now become interesting for other reasons; schools in the UK are now shut and the government recently announced that GCSE and A-level exams have been cancelled. Instead, grades will be awarded by Ofqual using a combination of teacher assessment, prior grades and other school data. Ofqual haven’t yet explained exactly how this will work.
Understandably, this has generated a fair bit of concern from students, parents and teachers. I suspect that students, on the whole, will have been hoping for grades to be awarded on the basis of teacher predicted grades, and may be suspicious of any algorithms or processes that Ofqual might use.
But on the flip side, the government/Ofqual really do have quite a large amount of data about both individual students, and their schools across many years of study. This makes me wonder how accurately the government could predict the grades of individual students, if it were entirely in their hands?
Obviously, with only aggregated data at the school level, I can’t answer that question, but the dataset does at least enable me to answer a proxy question - how well could the government predict the average grades for individual schools?
GCSE 2018-2019 Data
There are two “core” GCSE measures: average attainment 8 score, and average progress 8 score.
Attainment 8 measures the achievement of students across 8 qualifications, assigning double weighting to Maths and English. The other qualifications must be on the Department for Education’s approved list. If a student doesn’t have 8 qualifications from the approved list, they are given a score of 0 for each absent qualification. This proves to be a problem when we look at average attainment 8 for Independent schools, since many of these schools are not yet following the new GCSE system - meaning that students in these schools wind up with inaccurately low attainment 8 scores.
Progress 8 is a measure of how well a student has progressed relative to other pupils nationally who have achieved similar prior attainment. The measure basically compares the student’s progress 8 to the average score obtained by students in their prior attainment group. Details of how it is calculated can be found on the Dept for Education’s website. Progress 8 can be a bit of a tricky measure to interpret for a number of reasons, particularly at the school-aggregated level, because it is sensitive to outliers. Irritatingly, progress 8 scores are also not shared for Independent schools.
In my analysis, I will be focussing on attainment 8 scores for now, which I consider somewhat easier to interpret. I will also be excluding independent schools from the analysis, since their attainment 8 scores cannot be compared properly to those of state schools.
Excluding these schools, I end up with a data set including grammar schools, state schools, and special schools:
school | school_type | gender | num_pupils | att8_17 | perc_fsm | perc_sec_lang | perc_sen | att8 |
The UCL Academy | State School | Mixed | 171 | 47.2 | 59 | 63 | 14 | 50.3 |
Haverstock School | State School | Mixed | 199 | 44.9 | 59 | 71 | 12 | 42.4 |
Parliament Hill School | State School | Girls | 175 | 57.1 | 54 | 42 | 10 | 58.7 |
Regent High School | State School | Mixed | 154 | 39.9 | 73 | 74 | 12 | 42.2 |
Hampstead School | State School | Mixed | 200 | 44.2 | 64 | 66 | 11 | 44.8 |
Acland Burghley School | State School | Mixed | 137 | 48.0 | 53 | 34 | 24 | 47.5 |
The Camden School for Girls | State School | Girls | 107 | 65.6 | 36 | 55 | 24 | 63.4 |
Maria Fidelis Catholic School FCJ | State School | Mixed | 115 | 42.0 | 50 | 56 | 14 | 48.4 |
William Ellis School | State School | Boys | 111 | 44.0 | 52 | 59 | 8 | 46.3 |
La Sainte Union Catholic Secondary School | State School | Girls | 173 | 57.1 | 42 | 53 | 14 | 54.6 |
Alongside the school name, we have the following variables:
- school_type: whether the school is a state school, grammar school, or special school
- gender: whether the school is mixed, girls-only, or boys-only
- att8_17: the school’s average attainment 8 score in 2017-2018
- perc_fsm: the percentage of FSM students in the school
- perc_sec_lang: the percentage of English as a second language (EAL) students
- perc_sen: the percentage of special needs students in the school
- att8: the school’s average attainment 8 score in 2018-2019
(There are many other accompanying variables in the full dataset, although I have captured the main demographics available here. The code used to clean and extract these variables can be found on my “GCSEs” github project).
Distrubution of Scores
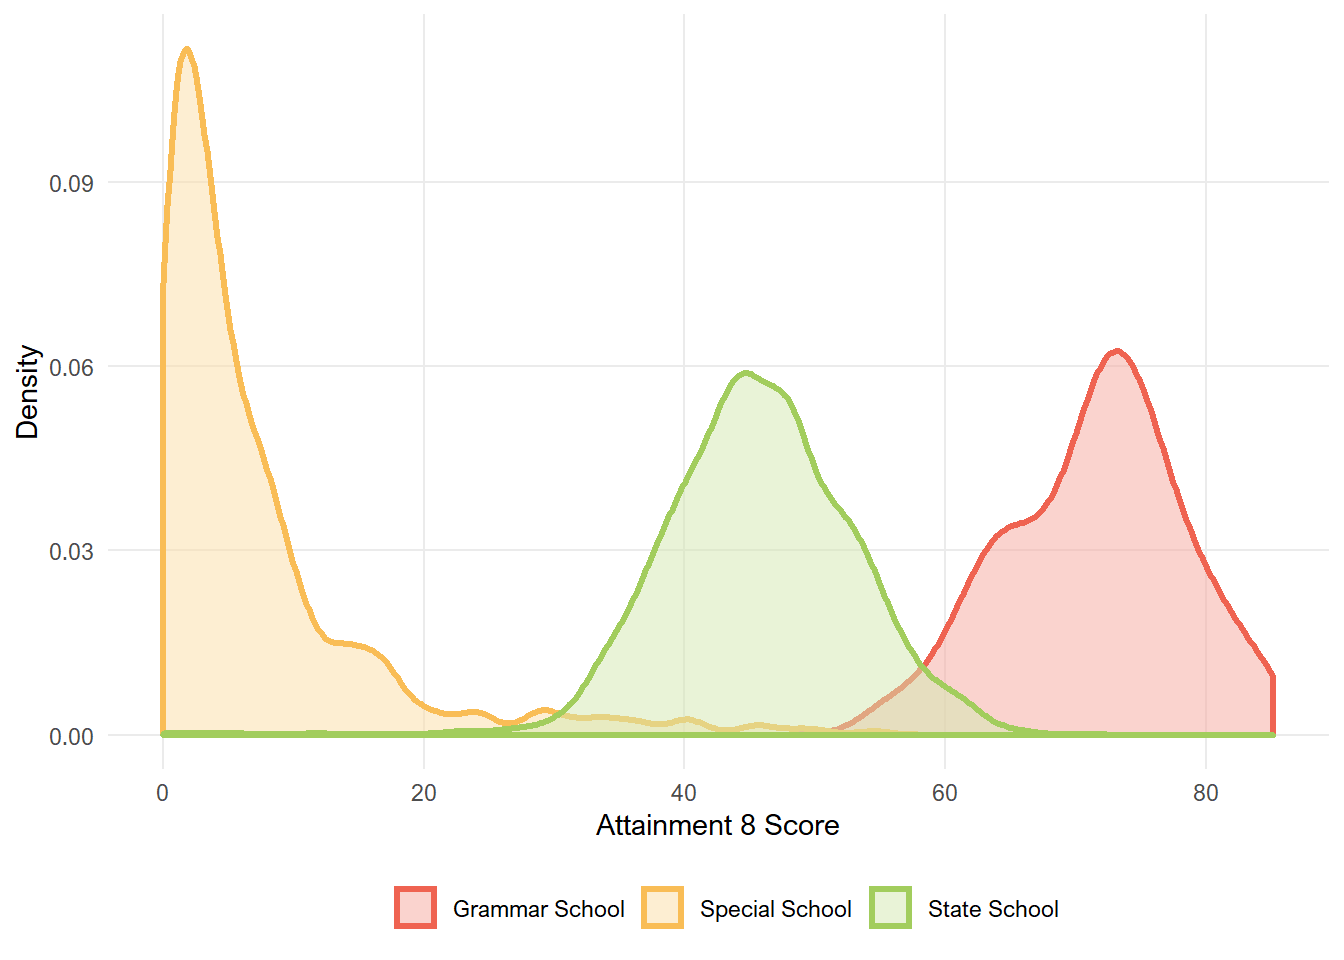
The distribution of school average attainment 8 scores is as follows:

We can see that for state schools, the data is roughly normally distributed, with slight negative skew.
Unsurprisingly, grammar schools generally have higher attainment 8 scores than state schools. There’s a funny bimodal peak to the distribution - which I would interpret cautiously given that there are only 163 grammar schools (compared with ~3000 state schools).
Special schools have much lower attainment 8 scores, and the data is positively skewed. It’s worth noting that students in special schools may not always do the same qualifications which is likely to make the scores hard to interpret. As a result, I’ll be excluding special schools from further analysis.
Relationship with Demographic Variables
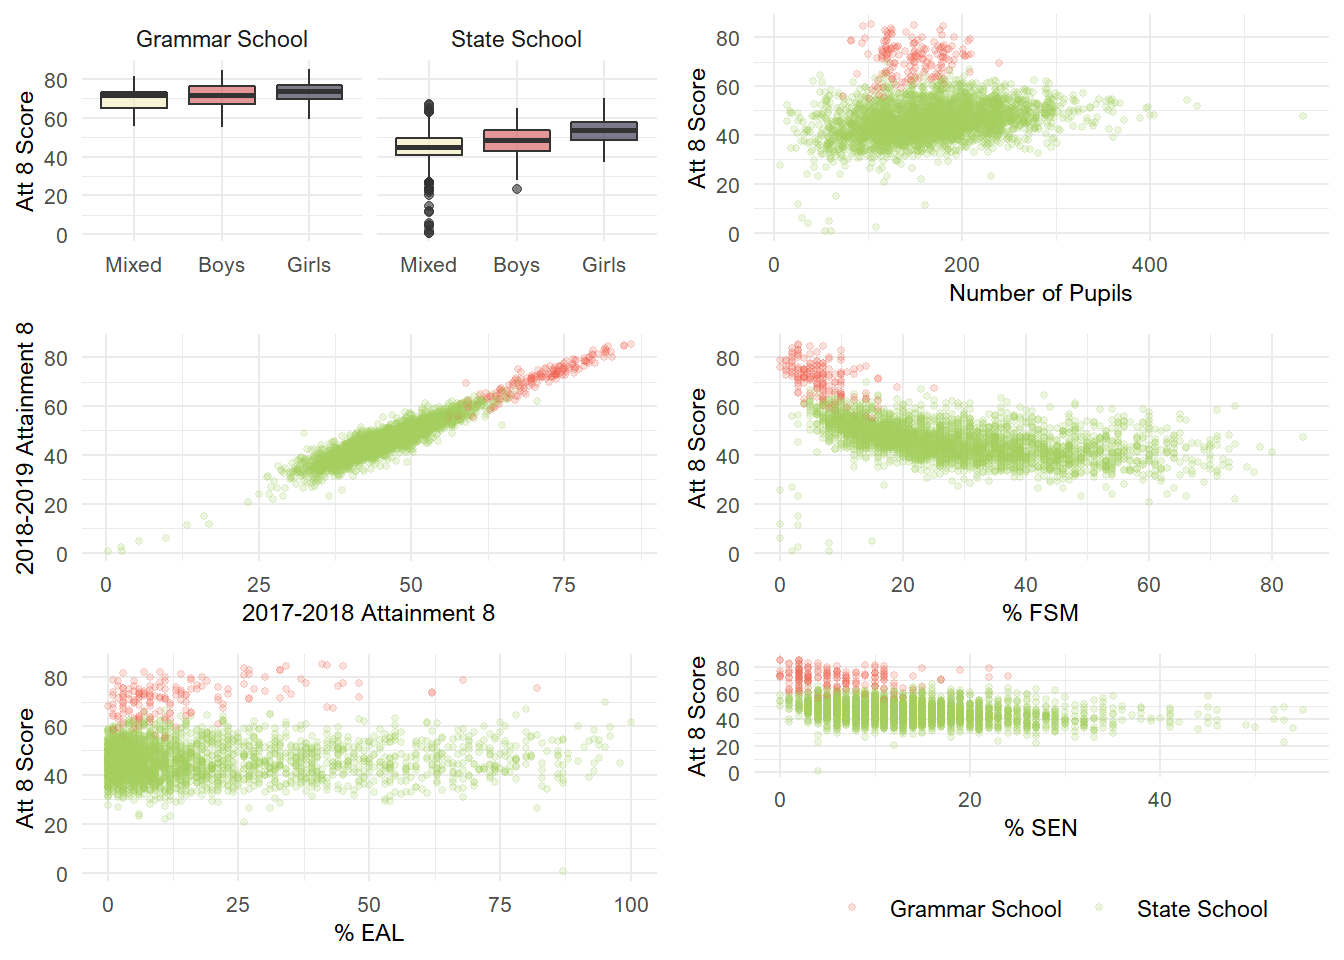
The plots below show how attainment 8 varies depending on each of our other demographic variables.

The relationships vary in magnitude, but it looks like all of these variables share some relationship with attainment 8 scores. Notably, this is very much more true for state schools than grammar schools.
Some variables, such as pupil number and percentage EAL students share small correlations with attainment 8 scores. The percentage of SEN students also shares a negative correlations with attainment 8 scores.
The variable most correlated with attainment 8 is clearly the school’s 2017-2018 attainment 8 score. This is particularly interesting given that the government has implied that they may use the prior grades of schools to moderate student grades assigned to students this year.
The percentage of FSM students also share a substantial correlation with attainment 8. Not that surprising given the established relationship between income level and educational achievement.
Finally, there’s a clear effect of gender, whereby mixed schools tend to do less well, and girls-only schools tend to do best.
Regression Modelling
To model the effects of each variable on attainment 8, I’ve opted to use multiple linear regression. (I did also play around with quantile regression on this dataset, which I may blog about in a separate post…). It’s probably not the technique that yields the best prediction accuracy, but I want an interpretable model. I think opting for something interpretable is more realistic too - the goal of predicting student grades to replace actual exam grades is so high stakes that I suspect if the government were to do this, they’d want a model they could understand!
The scatterplots I made above indicate that many of the variables I’m adding into the model have a substantially larger effect on state schools than grammar schools. I could model this with an interaction term, but since the total number of grammar schools is small I’ve instead opted to focus just on state schools.
Since this is a prediction task, I’m dividing the data into a training set to develop the model, and a test set for model validation:
gcses_state <- gcses %>%
  filter(school_type == "State School") %>%
  drop_na()

set.seed(2115)

trainIndex <- createDataPartition(gcses_state$att8, p = .7, list = FALSE)
  # note that I'm using simple bootstrap resampling for cross-validation here

training <- gcses_state[ trainIndex,]

test <- gcses_state[-trainIndex,]
This is the model summary on the training set:
##
## Call:
## lm(formula = .outcome ~ ., data = dat)
##
## Residuals:
##      Min       1Q   Median       3Q      Max
## -10.2813  -1.7143   0.0114   1.7282   9.4128
##
## Coefficients:
##                Estimate Std. Error t value Pr(>|t|)
## (Intercept)    8.935024   0.915347   9.761  < 2e-16 ***
## num_pupils     0.001810   0.001136   1.593    0.111
## gender.L       0.580211   0.729271   0.796    0.426
## gender.Q      -0.225459   1.188180  -0.190    0.850
## perc_fsm      -0.054138   0.006446  -8.399  < 2e-16 ***
## perc_sen      -0.037096   0.009272  -4.001 6.58e-05 ***
## perc_sec_lang  0.025151   0.003953   6.363 2.51e-10 ***
## att8_17        0.845641   0.013043  64.837  < 2e-16 ***
## ---
## Signif. codes:  0 '***' 0.001 '**' 0.01 '*' 0.05 '.' 0.1 ' ' 1
##
## Residual standard error: 2.716 on 1761 degrees of freedom
## Multiple R-squared:  0.826,  Adjusted R-squared:  0.8253
## F-statistic:  1194 on 7 and 1761 DF,  p-value: < 2.2e-16
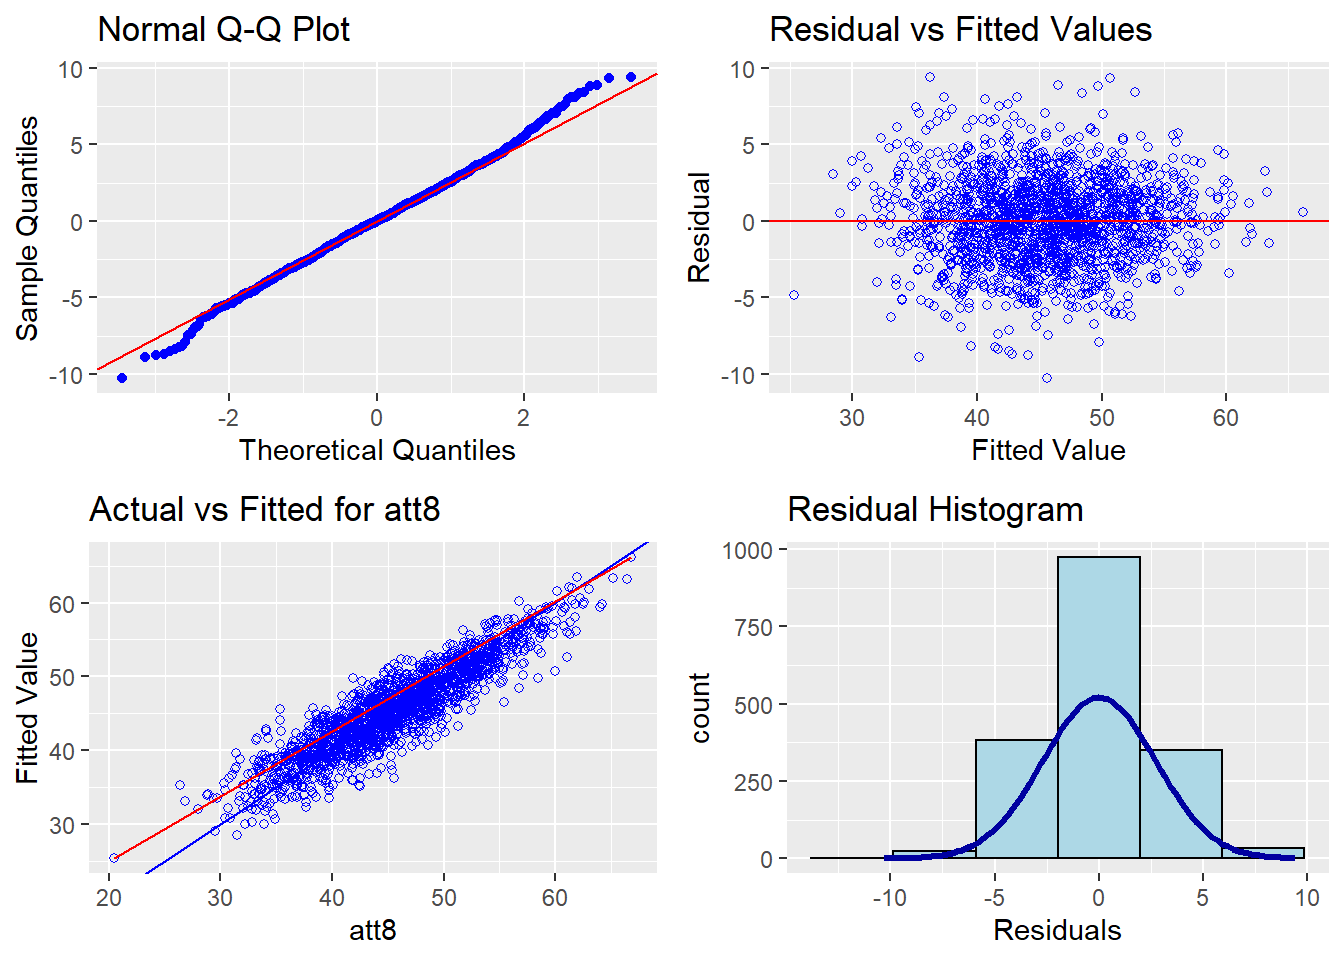
And here are the diagnostic plots:

So what can we tell from this? Well, for a start, all of our variables are significant predictors. As it stands, the model accounts for ~ 84% of the variance in school attainment 8 scores. This is pretty good, although far from perfect. The school’s prior grades appear to be one of the strongest predictors of the 2018-2019 grades. (And it might be an even stronger predictor had I included data from years prior to 2017-2018 as well). The gender distribution in the school is also an important predictor, with all-girls schools achieving significantly better grades than mixed and all-boys schools.
The diagnostics are also interesting: the assumptions of linearity and normality hold up pretty well, although there is some deviance in residuals in the bottom quantile. The plot of actual versus fitted values is also enlightening - from this we can see that the model does least well at predicting the values for schools with lower attainment 8 scores, and tends to underestimate values for these schools.
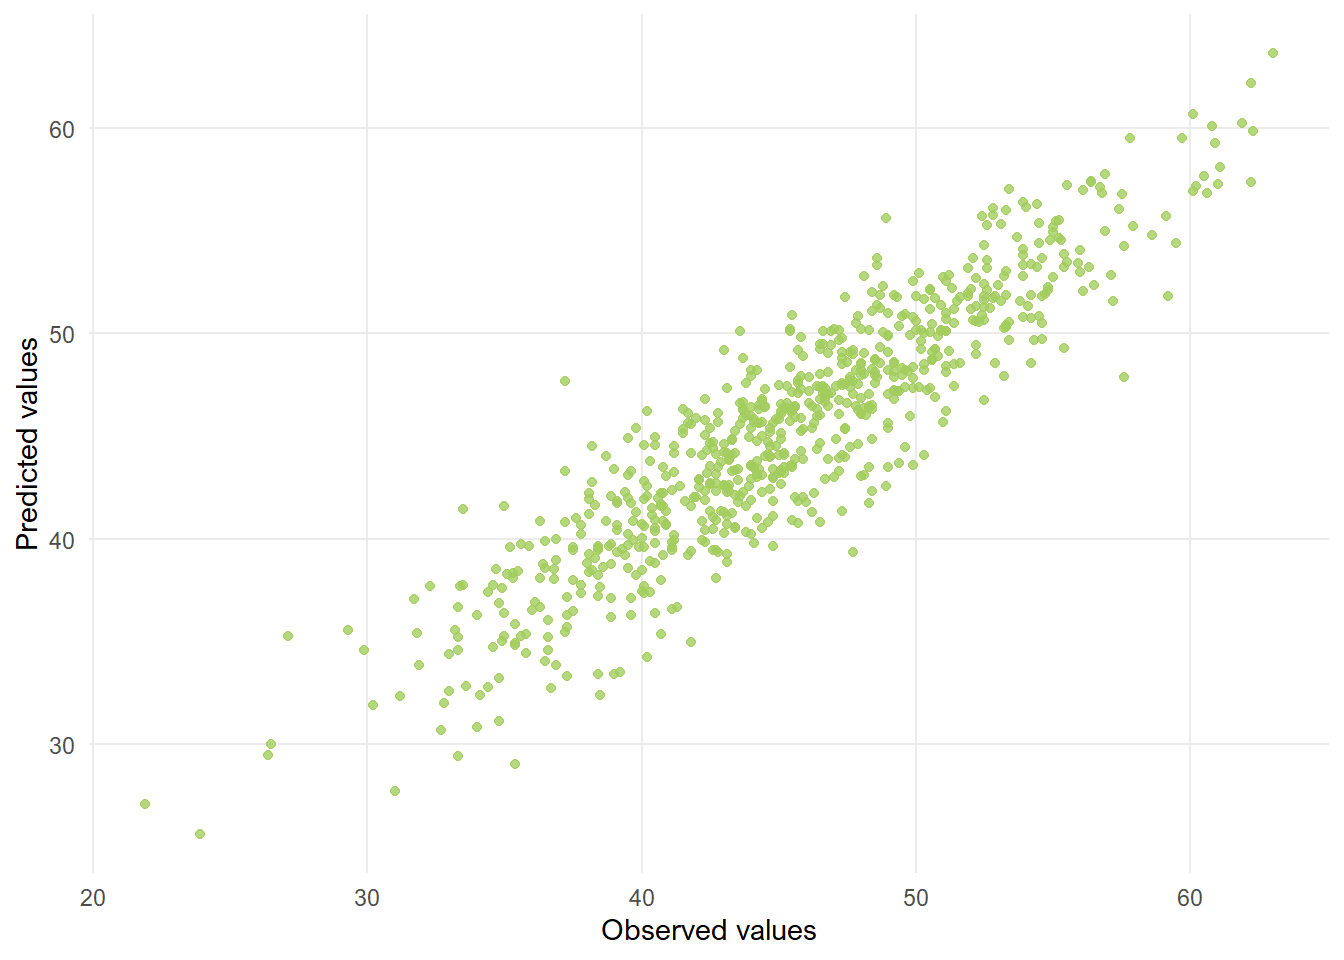
Now, this is how the model performs on the training data, but what about the test data?
predict <- predict(gcse_fit, test)

postResample(pred = predict, obs = test$att8)
## RMSE Rsquared MAE
## 2.6736813 0.8310062 2.0984710Reassuringly, the root mean square error and adjusted R2 look very comparable to those obtained with the training data. The plot of actual versus predicted values also looks pretty good:

Conclusions
The model fit achieved even with this simple model suggests that student grades could be predicted reasonably well from existing data. I suspect that with access to individual level data, the government could achieve an even better fit.
That being said, there are still some problems:
- Since students won’t be taking exams this year, we’d never know how accurate the predictions really were
- There’s no obvious way to predict or moderate grades of private candidates
- Even if the model has reasonably high accuracy, the model wouldn’t be accurate for all students
The biggest issue with inaccuracy lies in the fact that the model becomes less accurate for schools with lower attainment 8 scores, which are often the schools with the most economically disadvantaged students. Since the model underestimates grades in these schools, it looks like students at these schools might be the most disadvantaged by a solution that relied on prediction based on prior data. This is likely to be compounded by the fact that these schools tend to display more variability in grades both within and across cohorts. Hopefully this is something that Ofqual will take into consideration.
Nonetheless, given that Ofqual are likely to use a school’s prior grades to moderate student grades this year, it’s interesting to see that it can be a pretty strong predictor of grades (at least at the aggregate level). I’d be keen to find out how they’re planning to use this information. (Update: The most recent statement suggests that prior school performance is likely to play an important part in moderating teacher judgements!)
Fundamentally, there’s no perfect solution to this problem. I think using both school and individual student data alongside teacher predictions is a sensible solution, even if some students are likely to be unhappy. (In light of this, it’s great that students will be given the option to take an exam later in the year if they’re not happy with their assigned grade). It also seems to me to be more reliable and fair than relying purely on teacher predictions.
Without getting all students to take an exam later next year, we’ll also never find out how accurate the process that Ofqual settles on really ends up being… though I suspect that even if Ofqual were able to assign grades that perfectly predicted the grades students would have obtained in their GCSE exam, we’d still see some unhappy students, teachers and parents.
Finally, it’s worth pointing out that assessing a student’s ability is an incredibly difficult task, and end of year exams aren’t a perfect predictor of a student’s abilities in the first place.