Gains Checker - An Adventure in Shiny Apps
I’ve been working on my physical strength on and off for around 2.5 years now. I love strength training. It’s great for a number of reasons; t helps you maintain your muscles as you get older and build stronger bones, it can help improve your posture and give you a more toned body, and you get a sense of relatively rapid progression. Plus it’s generally a pretty awesome feeling to be able to pull your whole body up or lift heavy things.
It’s only more recently though that I’ve begun thinking a bit more about how nutrition feeds into my strength training and fitness. In particular, I’ve been advised to increase my protein intake to help build muscle mass. Apparently, it’s quite common for women who lift to not be eating enough protein in their diet.
So began an adventure in looking a bit more carefully at what I eat, and what’s inside it. Turns out, I really wasn’t eating a great deal of protein. Now, I don’t think it’s a huge deal - seems to me that unless you’re aiming for ginormous bulging muscles or doing a huge amount of exercise, you don’t need that much protein… and certainly not as much as some gym bros might lead you to believe. But still, I figured I could do with getting a bit more protein in my diet.
But, how to know which foods give you the best protein hits?
I tried using MyFitnessPal for a while but it honestly drove me a bit mental. For a start, all I wanted was roughly how much protein I was eating. I didn’t want to track every single morcel of food and monitor every calorie. On a separate note, the excessive push notifications also drove me off the walls.
So instead, I made myself a little app to find out how much protein there is in different foods I might eat.
I made it using in R using the shiny library, and currently have it hosted on shinyapps.io, here.
Getting the data wasn’t pretty. There was no single beautiful datasource that I could find for this, so I had to scoure the web for various different resources, including nutritionvalue.org and nutrition.org.uk. I don’t have a huge variety of foods on there yet, and am still planning to add more to it, but here’s what the data looks like:
library(dplyr)
library(magrittr)
library(readr)
library(ggplot2)

proteins <- read_csv("../../resources/gains-checker-shiny-apps/protein-content-food.csv") %>%
  select("Food Type" = class,
         "Food" = food,
         "Protein (g) per 100g" = protein_per_100g)

proteins %>%
  head(10) %>%
  flextable::regulartable() %>%
  flextable::autofit()
Food Type | Food | Protein (g) per 100g |
Meat | Chicken Thigh or Drumstick | 15.0 |
Meat | Chicken Breast | 32.0 |
Meat | Beef Steak | 31.0 |
Meat | Lamb Chop | 29.2 |
Meat | Pork Belly | 9.3 |
Meat | Pork Sausage | 14.0 |
Meat | Pork Bacon | 20.0 |
Meat | Pork Chop | 31.6 |
Fish | Tuna | 23.5 |
Fish | Mackerel | 20.8 |
For instance, here are the top 20 most protein-rich foods in my current dataset:
proteins %>%
  top_n(20, `Protein (g) per 100g`) %>%
  ggplot() +
  geom_col(aes(reorder(Food, `Protein (g) per 100g`),
               `Protein (g) per 100g`,
               fill = `Food Type`),
           alpha = 0.7) +
  labs(x = "Food Type",
       y = "Protein (g) per 100g") +
  coord_flip() +
  jcolors::scale_fill_jcolors("pal4") +
  theme_minimal() +
  theme(text = element_text(colour = "gray18"))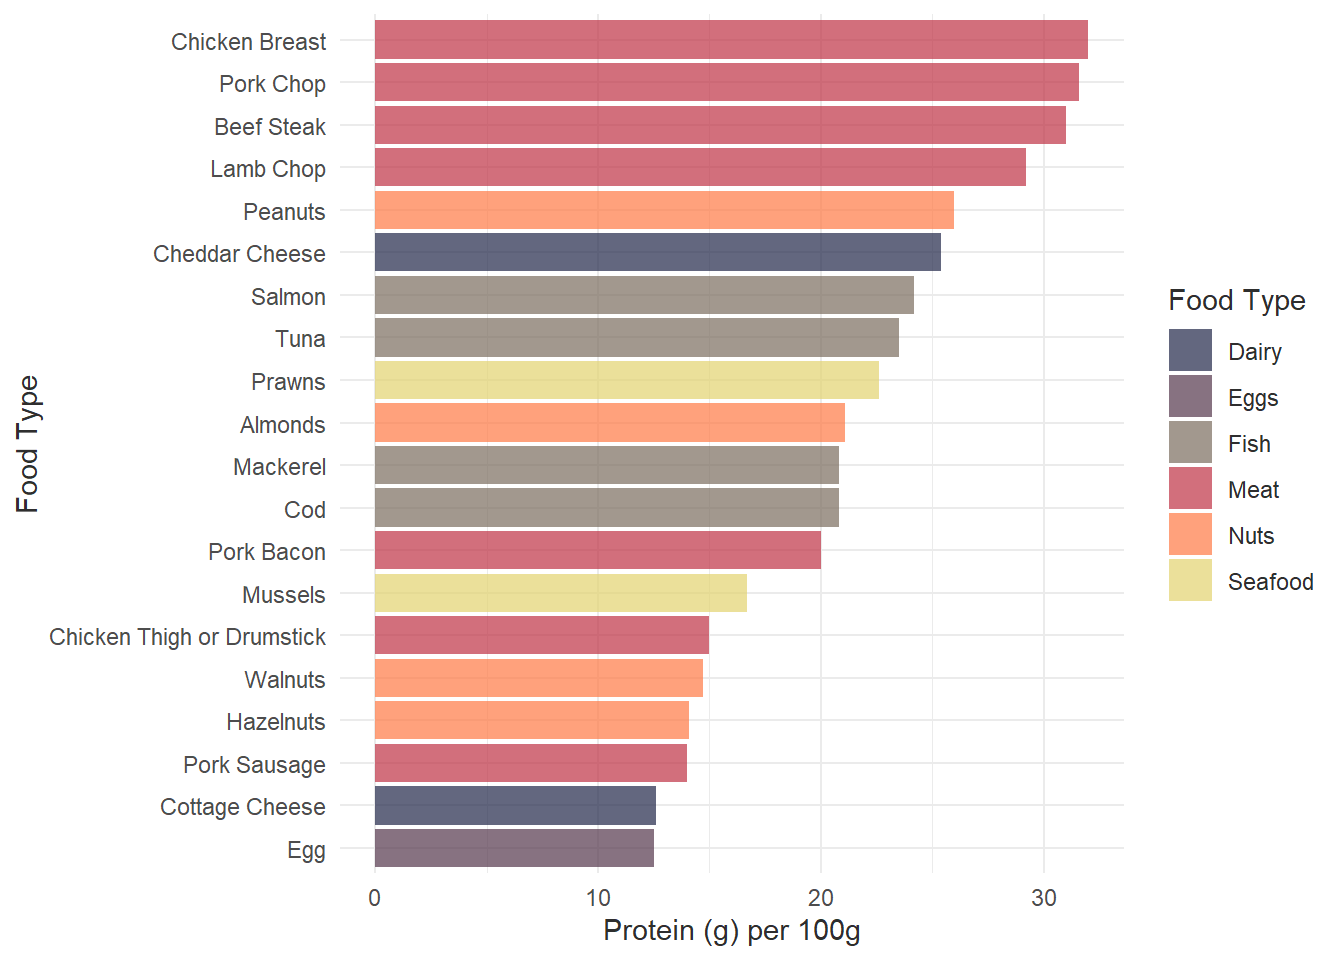
(Big up peanuts and cheddar cheese!!)
And, here’s the code I used to create the app:
# libs ----------------------------------------------------

library(shiny)
library(shinyWidgets)
library(formattable)

# set-up ui -----------------------------------------------
ui <- fluidPage(
  theme = shinythemes::shinytheme("flatly"),

  headerPanel(strong("Gains Checker")),

  sidebarLayout(
    sidebarPanel(
      helpText("Enter a food type to check protein content per 100g."),

      textInput("food",
                label = "Enter a food here:"),

      selectInput("category",
                  label = "Select a food category here:",
                  choices = c("All", proteins$`Food Type`),
                  selected = "All")
    ),

    mainPanel(
      formattableOutput("proteinTable")
    )
  )
)

# define server logic ---------------------------------------
server <- function(input, output) {

  output$proteinTable <- renderFormattable({
    req(input$food)

    if(input$category == "All") {

      proteins %>%
        filter(stringr::str_detect(tolower(Food), tolower(input$food))) %>%
        select(`Food`, `Food Type`, `Protein (g) per 100g`) %>%
        formattable::formattable(
          align = "l",
          list(`Protein (g) per 100g` = color_tile("#ffe1e1", "#ff9d9d")))

    } else {

    proteins %>%
      filter(stringr::str_detect(tolower(Food), tolower(input$food))) %>%
      filter(`Food Type` == input$category) %>%
      select(`Food`, `Food Type`, `Protein (g) per 100g`) %>%
      formattable::formattable(
        align = "l",
        list(`Protein (g) per 100g` = color_tile("#ffe1e1", "#ff9d9d")))
    }

  })
}

# Run the application ----------------------------------------
shinyApp(ui = ui, server = server)
Some of the more fun bits I had to figure out when making this app:
- Preventing the table from showing if the user hasn’t typed anything yet: turns out, shiny has a neat function called
req()that can be used for this. - Creating a search bar that updates as soon as the user begins typing, and that doesn’t require the user to type in a food exactly as it appears on the table:
selectInput()got me most of the way there on this one. ALl I had to do after was remove upper casing from both the user input string and the strings in my table. - Enabling an option to view foods from all categories and not having to select one particular category: To do this, I added an “All” option to the drop-down options on the UI side, and added a simple ifelse statement on the server side.
- Making the table pretty with formattable: I opted for formattable here to add pretty coloured bars to the table values. To use formattable within shiny you need to use
formattableOutput()andrenderFormattable()instead of the standardtableOutput()andrenderTable(). - Making the whole thing pretty: Honestly, in the end I wound up using shinythemes since I quickly found a theme that looked clean and nice.
I’m hoping to keep updating this dataset with more tasty food items. In the future I might also add some extra features to the app! Who knows, I might even use it as an opportunity to practice custom CSS.