Cleaning Dirty Excel Sheets in R
I spend a great deal of my spare time searching for, and playing with, open source data. Although it’s great fun, a challenge of working with this kind of data is that it usually isn’t stored in a tidy format. Very occasionally, I’ll find a carefully constructed csv made by a generous soul, but most often what I get is a somewhat messy Excel file.
Messy data can come with a vast array of different problems. However, I’ve found that there are some key repeat offenders that tend to crop up time and time again with data stored in Excel files:
- Column titles spread across multiple rows
- Variables spread across multiple columns
- Data spread across multiple Excel sheets
- Data are stored unevenly across Excel sheets
My solutions to these issues definitely aren’t the only ones available, and probably aren’t always the most elegant (if you have a more elegant solution please hit me up!). But, these solutions have served me pretty well, so I figured that they were worth sharing.
To demonstrate my solutions to messy data, I’m using a station passengers number dataset I obtained from TfL. The data gives the average daily entries and exits for each tube station, from 2007-2017. (The data is available here on the TfL website.)
This is what the dataset looks like in Excel: 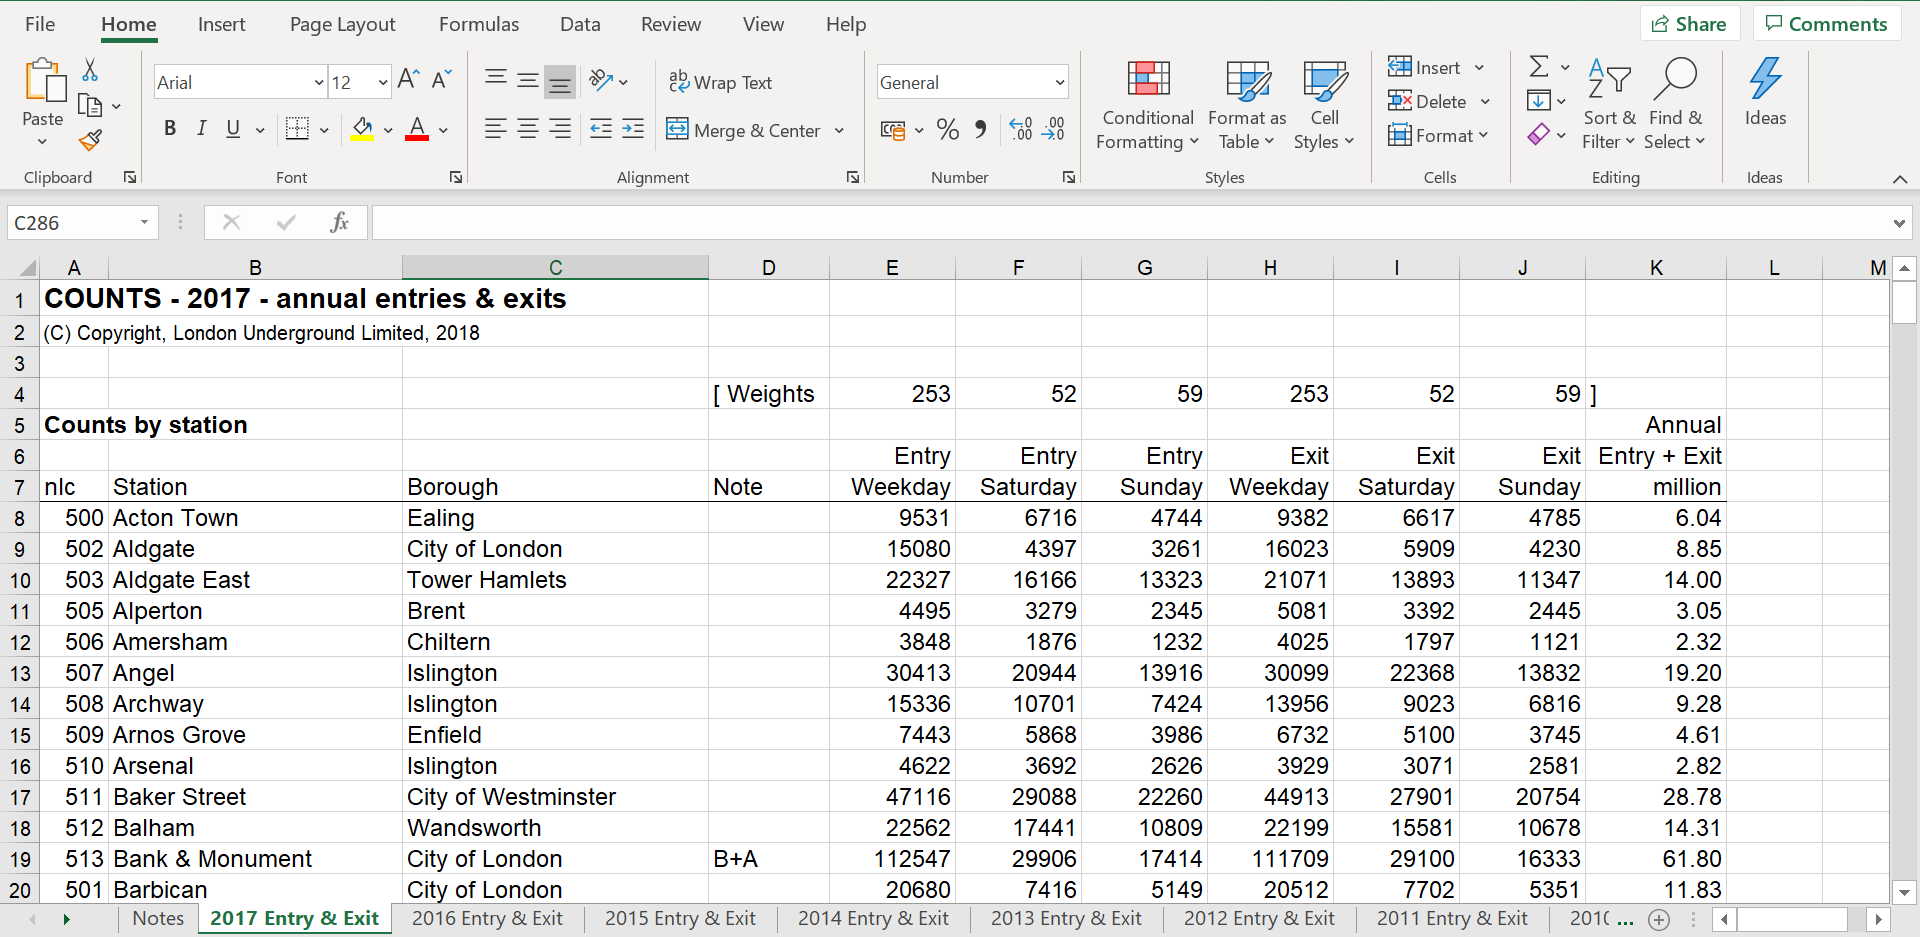
Now, all 4 of the problems listed above appear in this dataset:
- The column titles are spread across 3 rows
- Two of our variables (day of the week and direction of flow) are spread across multiple columns
- The data for each year are spread across multiple Excel sheets ranging from 2007 to 2017
- Most annoyingly, the “borough” variable only appears in 2014, meaning that the total number of columns varies across sheets.
To go through these problems, I’m going to start by fixing just the 2017 sheet, and then look at how to extend the solution to clean multiple spreadsheets at once.
Problem 1: Column Titles Are Spread Across Mutiple Rows
This is one of my least favourite problems, but also one of the most common.
Spreading column titles across multiple rows might more visually appealing if you’re trying to report summary statistics, but it’s a bummer if you want to do any analysis. Reading our sheet into R immediately reveals why this isn’t ideal.
read_excel("../../resources/tube-station-visits/station-entry-and-exit-figures.xlsx",
           sheet = "2017 Entry & Exit",
           skip = 4) %>%
  head(5) %>%
  regulartable() %>%
  autofit()
Counts by station | ...2 | ...3 | ...4 | ...5 | ...6 | ...7 | ...8 | ...9 | ...10 | Annual |
Entry | Entry | Entry | Exit | Exit | Exit | Entry + Exit | ||||
nlc | Station | Borough | Note | Weekday | Saturday | Sunday | Weekday | Saturday | Sunday | million |
500 | Acton Town | Ealing | 9531 | 6716 | 4744 | 9382 | 6617 | 4785 | 6.0405160000000002 | |
502 | Aldgate | City of London | 15080 | 4397 | 3261 | 16023 | 5909 | 4230 | 8.84694 | |
503 | Aldgate East | Tower Hamlets | 22327 | 16166 | 13323 | 21071 | 13893 | 11347 | 13.998291999999999 |
Blurgh.
If I’m feeling lazy, I’ll sometimes avoid the problem altogether by skipping everything except the last row of column names when I read in the sheet, like this:
read_excel("../../resources/tube-station-visits/station-entry-and-exit-figures.xlsx",
           sheet = "2017 Entry & Exit",
           skip = 6) %>%
  head(5) %>%
  regulartable() %>%
  autofit()
nlc | Station | Borough | Note | Weekday...5 | Saturday...6 | Sunday...7 | Weekday...8 | Saturday...9 | Sunday...10 | million |
500 | Acton Town | Ealing | 9531 | 6716 | 4744 | 9382 | 6617 | 4785 | 6.040516 | |
502 | Aldgate | City of London | 15080 | 4397 | 3261 | 16023 | 5909 | 4230 | 8.846940 | |
503 | Aldgate East | Tower Hamlets | 22327 | 16166 | 13323 | 21071 | 13893 | 11347 | 13.998292 | |
505 | Alperton | Brent | 4495 | 3279 | 2345 | 5081 | 3392 | 2445 | 3.052230 | |
506 | Amersham | Chiltern | 3848 | 1876 | 1232 | 4025 | 1797 | 1121 | 2.321692 |
Unfortunately, the lazy option isn’t going to fly with this data: if I skip the first row of the column names I wind up with repeat variable names, and there’s no way to tell whether the columns correspond to entry or exit data.
So, we do need to get the full column names into R somehow… but how?
First, we need to read the rows corresponding just to the column names into R.
col_names <- read_excel(
  "../../resources/tube-station-visits/station-entry-and-exit-figures.xlsx",
                        sheet = "2017 Entry & Exit",
                        skip = 4, n_max = 2)

col_names %>%
  regulartable() %>%
  autofit()
Counts by station | ...2 | ...3 | ...4 | ...5 | ...6 | ...7 | ...8 | ...9 | ...10 | Annual |
Entry | Entry | Entry | Exit | Exit | Exit | Entry + Exit | ||||
nlc | Station | Borough | Note | Weekday | Saturday | Sunday | Weekday | Saturday | Sunday | million |
At the moment, the column names are being stored as a two row dataframe. But, what we’ll want is to extract these column names into a simple vector. We can do this using a combination of paste() and unlist() (a function that converts lists back into vectors).
col_names <- paste(unlist(col_names[1,], use.names = FALSE), # extract first row
                  unlist(col_names[2,], use.names = FALSE), # extract second row
                  sep = "_")

col_names
## [1] "NA_nlc" "NA_Station" "NA_Borough"
## [4] "NA_Note" "Entry_Weekday" "Entry_Saturday"
## [7] "Entry_Sunday" "Exit_Weekday" "Exit_Saturday"
## [10] "Exit_Sunday" "Entry + Exit_million"We’re now almost there, but some of the column names are a little gross because the first row of name was an NA value. To fix this, we can use the str_remove() function from the stringr package.
col_names <- str_remove(col_names, "NA_")

col_names
## [1] "nlc" "Station" "Borough"
## [4] "Note" "Entry_Weekday" "Entry_Saturday"
## [7] "Entry_Sunday" "Exit_Weekday" "Exit_Saturday"
## [10] "Exit_Sunday" "Entry + Exit_million"Now that our column names are stored in a clean vector, all we need to do is supply these as the column names when we read in our sheet!
read_excel("../../resources/tube-station-visits/station-entry-and-exit-figures.xlsx",
           sheet = "2017 Entry & Exit",
           skip = 7,
           col_names = col_names) %>%
  head(5) %>%
  regulartable() %>%
  autofit()
nlc | Station | Borough | Note | Entry_Weekday | Entry_Saturday | Entry_Sunday | Exit_Weekday | Exit_Saturday | Exit_Sunday | Entry + Exit_million |
500 | Acton Town | Ealing | 9531 | 6716 | 4744 | 9382 | 6617 | 4785 | 6.040516 | |
502 | Aldgate | City of London | 15080 | 4397 | 3261 | 16023 | 5909 | 4230 | 8.846940 | |
503 | Aldgate East | Tower Hamlets | 22327 | 16166 | 13323 | 21071 | 13893 | 11347 | 13.998292 | |
505 | Alperton | Brent | 4495 | 3279 | 2345 | 5081 | 3392 | 2445 | 3.052230 | |
506 | Amersham | Chiltern | 3848 | 1876 | 1232 | 4025 | 1797 | 1121 | 2.321692 |
Problem 2: Variables Are Spread Across Multiple Columns
Right now, when we read in our data, we have two variables spread across 6 columns: type of day (Weekday vs Saturday vs Sunday), and direction of flow (Entry vs Exit). What we want is to simplify this to have one column for type of day, and one for direction of flow.
Luckily, the tidyr package offers a simple fix in the form of the gather() function (which I understand is being superseded by pivot_longer()).
Now, if you just have one variable spread across multiple columns, you simply need to gather the columns into one in one short step. Here though, since we have two variables that are spread we’ll need to perform one extra step.
First, we need to gather all the misbehaving columns together into a ‘key’ column, specifying the type and day of passenger flow, and a ‘value’ column, giving the average number of passengers for each direction of flow and type of day.
read_excel("../../resources/tube-station-visits/station-entry-and-exit-figures.xlsx",
           sheet = "2017 Entry & Exit",
           skip = 7,
           col_names = col_names) %>%
  gather("Entry_Weekday":"Exit_Sunday", key = "flow", value = "daily_passengers") %>%
  head(5) %>%
  regulartable() %>%
  autofit()
nlc | Station | Borough | Note | Entry + Exit_million | flow | daily_passengers |
500 | Acton Town | Ealing | 6.040516 | Entry_Weekday | 9531 | |
502 | Aldgate | City of London | 8.846940 | Entry_Weekday | 15080 | |
503 | Aldgate East | Tower Hamlets | 13.998292 | Entry_Weekday | 22327 | |
505 | Alperton | Brent | 3.052230 | Entry_Weekday | 4495 | |
506 | Amersham | Chiltern | 2.321692 | Entry_Weekday | 3848 |
Next, we can use the separate() function to separate the flow column into two variables - one describing the direction of flow of the passengers, and one describing the type of day.
read_excel("../../resources/tube-station-visits/station-entry-and-exit-figures.xlsx",
           sheet = "2017 Entry & Exit",
           skip = 7,
           col_names = col_names) %>%
  gather("Entry_Weekday":"Exit_Sunday", key = "flow", value = "daily_passengers") %>%
  separate(flow, into = c("flow_direction", "day_type"), sep = "_") %>%
  head(5) %>%
  regulartable() %>%
  autofit()
nlc | Station | Borough | Note | Entry + Exit_million | flow_direction | day_type | daily_passengers |
500 | Acton Town | Ealing | 6.040516 | Entry | Weekday | 9531 | |
502 | Aldgate | City of London | 8.846940 | Entry | Weekday | 15080 | |
503 | Aldgate East | Tower Hamlets | 13.998292 | Entry | Weekday | 22327 | |
505 | Alperton | Brent | 3.052230 | Entry | Weekday | 4495 | |
506 | Amersham | Chiltern | 2.321692 | Entry | Weekday | 3848 |
That’s one sheet fixed, only 10 more to go!
Now, we could just run the same code 10 more times to clean each sheet in the file… but that would be inefficient. Surely there’s a better way?
Problem 3: Data Are Spread Across Multiple Sheets
Here again, the tidyverse saves us with a function from the purrr package called map().
map() is a neat function that lets you apply a function to each element of a list.
There are over 20 different variants of this function, but we’ll be using map_df(). This variant of map takes the output of the mapping and combines it into a single dataframe.
This means that we can turn our sheet cleaning steps into a function, and then use map_df() to run the function on each Excel sheet in one go.
First, we need to turn the cleaning steps into a function. Along with the cleaning, I’m also adding a new variable, year, which we’ll need when we combine the sheets into one dataframe.
clean_sheets <- function(sheet) {

  # take the first four characters of each sheet to extract year
  year <- str_sub(sheet, 1, 4)

  tbl <- read_excel(
    "../../resources/tube-station-visits/station-entry-and-exit-figures.xlsx",
                    sheet = sheet,
                    skip = 7,
                    col_names = col_names) %>%
    gather("Entry_Weekday":"Exit_Sunday", key = "flow", value = "daily_passengers") %>%
    separate(flow, into = c("flow_direction", "day_type"), sep = "_") %>%
    mutate(year = year)

  tbl

}
Next, we need to map the cleaning function onto each Excel sheet.
To do this, we first need to create a vector with the names of all the Excel sheets to pass as an argument to map_df(). To show how this works, I’m going to start by just using the first three sheets of my Excel file containing the data from 2017-2015.
recent_station_sheets <- paste(seq(from = 2015, to = 2017, by = 1),
                        rep("Entry & Exit", 3),
                        sep = " ")
Then, we simply pass the list of sheets, and the cleaning function to map_df().
station_flow <- map_df(recent_station_sheets, clean_sheets)

station_flow %>%
  head(5) %>%
  regulartable() %>%
  autofit()
nlc | Station | Borough | Note | Entry + Exit_million | flow_direction | day_type | daily_passengers | year |
500 | Acton Town | Ealing | 6.235045 | Entry | Weekday | 9861 | 2015 | |
502 | Aldgate | City of London | 7.527810 | Entry | Weekday | 13645 | 2015 | |
503 | Aldgate East | Tower Hamlets | 12.839311 | Entry | Weekday | 20579 | 2015 | |
505 | Alperton | Brent | 3.205455 | Entry | Weekday | 4945 | 2015 | |
506 | Amersham | Chiltern | 2.287149 | Entry | Weekday | 3680 | 2015 |
Giving us all the data from 2017-2015 in one clean, tidy dataframe!
Now that we know the method works, we can apply the cleaning function to all 11 sheets at once:
# vector with the names of all 11 sheets
station_sheets <- paste(seq(from = 2007, to = 2017, by = 1),
                        rep("Entry & Exit", 10),
                        sep = " ")

station_flow <- map_df(station_sheets, clean_sheets)
## Error: Sheet 13 has 10 columns (10 unskipped), but `col_names` has length 11.Except… we get an error! So what’s going wrong?
4. Unequal Numbers of Columns Across Sheets
A bit of detective work reveals that the “borough” variable is missing from the all the Excel sheets prior to 2015.
This is why the previous step broke. In the previous cleaning function, we told R to use the col_names vector as the column names when reading in the Excel sheets. This works for the most recent sheets, which have 11 columns - the same as the length of the col_names vector. But, this breaks when we get to the 2014 sheet, which only has 10 columns.
To get around this problem, we need to make a few adjustments to our function.
# select just names for the 8 columns we need
col_names <- col_names[c(1, 2, 5, 6, 7, 8, 9, 10)]

col_names[9] <- "year"

clean_sheets <- function(sheet) {

  year <- str_sub(sheet, 1, 4)

  tbl <- read_excel(
    "../../resources/tube-station-visits/station-entry-and-exit-figures.xlsx",
                    sheet = sheet,
                    skip = 6) %>%
    select(nlc,
           Station,
           contains("day") # select any col containing "day"
           ) %>%
    mutate(year = year)

  colnames(tbl) <- col_names

  tbl

}
This time, I’m not passing the col_names vector in as the column names when I first read in the sheets. Instead, I read in the sheets using the bottom row of column titles.
Then, I remove any columns that I don’t need, including the offending “borough” column. Instead, I select just the columns I want, meaning that each sheet will have the same number of columns.
At this point, I can modify the column names to those in our col_names vector.
With this new and improved function, we can run map_df() again…
station_flow <- map_df(station_sheets, clean_sheets)

station_flow %>%
  head(5) %>%
  regulartable() %>%
  autofit()
nlc | Station | Entry_Weekday | Entry_Saturday | Entry_Sunday | Exit_Weekday | Exit_Saturday | Exit_Sunday | year |
500 | Acton Town | 9205 | 6722 | 4427 | 8899 | 6320 | 4304 | 2007 |
502 | Aldgate | 9887 | 2191 | 1484 | 10397 | 2587 | 1772 | 2007 |
503 | Aldgate East | 12820 | 7040 | 5505 | 12271 | 6220 | 5000 | 2007 |
505 | Alperton | 4611 | 3354 | 2433 | 4719 | 3450 | 2503 | 2007 |
506 | Amersham | 4182 | 1709 | 1004 | 3938 | 1585 | 957 | 2007 |
Et voila! A nice tidy dataframe eagerly awaiting some plots and analysis.