On A Levels, Ofqual and Algorithms
A Level results day is always a hugely important day for students and teachers across the country; a day that can have profound impact on a student’s future. This year’s A Level results day, however, was a particularly noisy affair. Due to COVID-19, exams were cancelled and students’ grades were instead set by a controversial algorithm designed by Ofqual.
Since grades were released last week, there has been a huge amount of complaint about the process and outcomes, including amongst other things, criticism of the algorithm for promoting unfairness and increasing social inequality. This has ultimately culminated in Ofqual admitting fault and reverting back to using the grade predictions set by schools (called centre assessed grades, or CAGs for short).
From what has been reported on social media and in the press, it seemed clear to me that Ofqual’s algorithm had issues. However, the exact details of the algorithm, and the issues with it, remained vague to me. As a result, I’ve spent the past few days going through the 319 page report that Ofqual have released describing how the algorithm works, how it was validated, and how it was selected. It’s a long, somewhat arduous read, and I still have unanswered questions about it. However, I’ve attempted to summarise my current understanding of Ofqual’s algorithm below, along with my own commentary about its shortcomings in the hope that it might help others understand what was done. (I am also including some screenshots of the report + page numbers to enable others to take a deeper look without having to comb through the whole report).
Ofqual’s Broad Approach
When exams were cancelled, Ofqual announced that grades would be assigned using a combination of school predicted grades and a moderation process yet to be determined. To aid this process, schools were asked to submit two key pieces of information about their students; a predicted grade for each student (the centre assessed grade, or CAG), and a rank ordering of every single student from best to worst (see page 11 of the report).
How this would be combined with Ofqual’s own data was left vague at this point. In the end, Ofqual largely ignored the centre assessed grades. Instead, student grades were determined by Ofqual’s algorithm, which generated predictions using a combination of the following data:
- the historical performance of each individual school
- the prior attainment of this year’s students
- the student rankings provided by each school
There are a few things to note straight off about the algorithm that Ofqual used.
First, the algorithm doesn’t directly predict individual students’ A level grades. What the model does is generate a prediction for how A level grades should be distributed within a given school. This is done using a combination of the school’s historical grade distribution in previous years, plus an adjustment for any differences in the prior attainment of this year’s cohort compared to previous years. With this, the model predicts the percentage of students at the school that should be allocated each A level grade. The student rankings provided by the school are then used to map students onto the predicted grade distribution.
Second, the algorithm isn’t really what I’d call a statistical model , in that the equation used to predict grade distributions isn’t derived from data. As far as I can tell, it’s been created heuristically.
Third, the data used to predict the school’s grade distribution is, in my opinion, a little scarce (though not without reason): the historical data relating to previous student cohorts consists of just two academic years’ worth of data (2017-2019). This is (I think) because A levels and GCSEs have undergone changes which would make data prior to 2016 hard to compare and use. In addition, the prior attainment data used in the model consists just of the current cohort’s GCSE grades. Data relating to the performance of students beyond GCSE (e.g. mocks, AS grades etc) is ignored because it is not standardised across schools.
Fourth, the algorithm was not used consistently across all schools and subjects. For schools with five or fewer students, the algorithm was not used and students were instead given their centre assessed grades. For schools deemed ‘small’, Ofqual used a combination of centre assessed grades and a downweighted version of the algorithm. This immediately introduces a first point of inequality into the grading system, since small schools are more likely to be independent schools, and centre predicted grades were higher than the grades generated by the algorithm.
The Algorithm: Details
This is the equation that Ofqual used to predict the grade distribution for a given school (page 93 of the report - note that there is a typo where the term \(C_{kj}\) is accidentally written as \(C_{k}\)). The output predicts, for a given grade \(k\), the percentage of students who should receive the grade in school \(j\):
\[ P_{kj} = (1 - r_{j})C_{kj} + r_{j}(C_{kj} + q_{kj} - p_{kj})\]
So what the heck does this equation actually mean?
First up, \(P_{kj}\) is the final prediction for the percentage of students in school \(j\) that should receive grade \(k\). Note that this is NOT the same thing as the \(p_{kj}\) term on the right-hand side of the equation.
The next easiest term to understand is \(C_{kj}\). This is the historical grade distribution in school \(j\) - i.e. the percentage of students in school \(j\) who achieved grade \(k\) in 2017-2019.
Next, we have this whole term:
\[(C_{kj} + q_{kj} - p_{kj})\] This bit represents the historical grade distribution in school \(j\), plus a correction for differences between the prior attainment of this year’s cohort versus the 2017-2019 cohorts. \(q_{kj}\) is the predicted grade distribution for the 2020 cohort based on their prior attainment, and \(p_{kj}\) is the predicted grade distribution for the historic 2017-2019 cohorts based on their prior attainment. At face value this may seem reasonable enough, but there are some issues with the way differences in prior attainment are adjusted for, which I’ll come to later.
Finally, \(r_{j}\) is the proportion of students in school \(j\) who could be matched to historic students based on prior attainment. The purpose of this term is to downweight the adjustment for prior attainment in cases where schools have a lot of missing data about student prior attainment. For instance, if none of the students in the 2020 cohort have GCSE data available, then \(r_{j} = 0\). In this case, the grade distribution for this year’s cohort is based entirely on the historical grade distribution in the school, with no correction for differences in prior attainment.
The output of this equation is a predicted grade distribution for a given school. Armed with this grade distribution, the next step is to use the teacher rankings to map the 2020 students onto this grade distribution.
Now, at this point, you might think we’re done - each student has received a grade. But, this isn’t where it actually ends. At this point, the student’s algorithmically generated grade is converted from an ordinal measure into a pseudo-numerical score using the rank data. In generating these scores, students are assumed to be equally spaced across the grade continuum. So, for instance, if there were 3 students ranked 1, 2, and 3 with an A grade in the school, the scores might look like this:
- student 1: 600 (‘high’ A)
- student 2: 550 (‘mid’ A)
- student 3: 500 (‘low’ A)
The formula used to create the pseudo-scores is described on page 95.
Now, in the usual exam setting, students start with a raw numerical score, which is eventually converted into an ordinal grade. So why, here, are we going from ordinal data to a pseudo-numerical score?
As it turns out, this is so that Ofqual can go through the same standardisation process that they would usually apply when students take exams -a standardisation they use to determine grade boundaries in a way that doesn’t lead to grade inflation from one year to the next. This standardisation process is only explained in very vague terms (it’s far less clear than the rest of the algorithm description) so I can’t explain exactly what happens here. However, the general process is that Ofqual looks at the pseudo-scores of all of the 2020 cohort and determines the final grade boundaries at a national level.
Effectively, what this means is that at this stage, students’ grades can be shifted downwards or upwards depending on where their pseudo-score places them relative to the rest of the student cohort. It’s the students at the ‘edges’ of a grade boundary that are susceptible here - for instance, the students who were originally with a ‘low’ or ‘high’ A are susceptible to seeing their grade shift downwards or upwards.
Standardising the grades at a national level isn’t a bad idea per se, although it could further diminish any attempts to account for differences in value-added across schools. However, what makes this final standardisation particularly problematic is that not all schools had their grade distributions determined in the same way. In small schools, students were allocated centre assessed grades instead of algorithmically generated grades. Now, these students already benefit from higher grades, since centre assessed grades were higher than the algorithmically generated grades. But, this isn’t the only problem. Standardising the grades at a national level means that the high grades of these students effectively pushes down the grades of students in larger schools, who are already subject to more downgrading. Since larger schools are more likely to be state schools, and small schools are more likely to be independent schools, this increases unfairness and disparity even further.
This itself is a big probelm, but I also have several other concerns with Ofqual’s algorithm and grade allocation procedure:
- The model does not take into account variability in grades from one year to the next.
- The algorithm does not seem to properly account for differences in the value-added across schools.
- The reliance on relative rank order.
- No quantification of uncertainty.
I’ll explain each of these issues in turn.
1. The model does not take into account variability in grades from one year to the next.
In some schools, performance may look very similar year on year, making it not totally unreasonable to try and predict the new cohort’s grade distribution from historic data. However, in other schools, performance may vary more widely year on year. In general, disadvantaged state schools are more likely to see larger variation in grades from one year to the next. However, Ofqual’s algorithm completely ignores the variability in performance year on year. For instance, it’s possible for performance to vary in a school such that a student achieves an A* this year despite no students having achieved an A between 2017-2019. However, the algorithm cannot account for events like this. This is yet another way that state schools in more deprived areas are disadvantaged by the model.
2. The algorithm does not seem to properly account for differences in the value-added across schools.
I’ve mentioned before that the algorithm tries to account for differences in prior attainment between the 2020 cohort and historical cohorts at the same school. The correction for differences in prior attainment basically asks the following: ‘based on what we know of the relationship between GCSE grade and A level grade at a national level, what grade distribution do we expect for this year’s cohort, at school \(j\), given their own GCSE grades? (This generates the term \(q_{kj}\) in the equation)
The same question is then asked for the historic cohort at school \(j\) - again, using the national value-added data to predict the grade distribution for this cohort (this generates \(p_{kj}\). The first term is subtracted from the other to account for differences in prior attainment.
The problem is that in school \(j\), students might get more of a boost in grade from GCSE to A level, or less of a boost than the national average. The equation seems to try and deal with this by also including \(C_{kj}\) - the 2017-2019 grade distribution at school \(j\). However, this only seems to account for the school-level value-added if:
- This year’s cohort are not that different in prior attainment to previous cohorts at school \(j\)
- The value-added at school \(j\) is linearly related to GCSE grade, such that all students get the same value-added at school \(j\) irrespective of their starting point.
3. Reliance on rank order.
The rank orders provided by schools form an important part of Ofqual’s model. There are some issues with the reliance on these rankings. For a start, it’s unlikely that this rank data is perfectly accurate and devoid of bias. However, even if the ranks are accurate, they don’t tell us anything about the size of the gap from one student to the next. This problem, combined with the mark imputation and national standardisation steps, is what creates the situation where two near-identically performing students from the same school, predicted the same grades by their centre, ended up with different grades.
4. No quantification of uncertainty.
The algorithm produces a grade for each student, but gives us no sense of the error around that estimate. This is particularly problematic given that a) the overall estimated accuracy of the model isn’t great (see the section on model validation further down), and b) most statistical models tend to be limited in their ability to accurately predict outcomes for individuals (as opposed to effects on a population level). A quantification of the uncertainty around the estimates could have also aided the appeals process.
Ofqual’s Rationale
There are a lot of questions we might ask about Ofqual’s chosen approach, but two key questions that I was looking for an answer to were: 1. Why did Ofqual decide not to use centre assessed grades at all in their model? 2. Why did Ofqual decide to predict the grade distribution for each school, rather than creating a model that predicted the grades of individual students?
The rationale for discarding centre assessed grades and instead relying on rankings is explained on pages 13-21 and can be summarised as follows:
- Differences in how strict centres were in generating grade predictions could lead to unfairness if too much weight was given to the centre assessed grades (page 20)
- Using centre assessed grades would cause significant grade inflation from last year to this year
- Psychological studies demonstrate that we are more accurate at making relative judgements (i.e. about rank) than we are at making absolute judgements.
While there is literature suggesting that we often find relative judgements easier than absolute judgements, there are a few caveats I would make here:
- Just because we find relative judgements easier doesn’t mean they’re perfect. The algorithm heavily depends on the accuracy of these teacher rankings, and Ofqual seems to treat the rankings as if they are near-perfect. This is despite the fact that (as stated in the report), correlations between teacher estimated rankings and actual ranks can be as low as 0.45 (page 15).
- Using relative ranking only leaves us with no sense of the distance between ranked individuals. For instance, do the students ranked 4 and 5 exhibit very similar performance, or is student 4 performing much better than student 5? We can’t tell from the relative rank alone.
The rationale for predicting grade distributions for each school, rather than individual grades is explained on pages 34-36.
In this section, Ofqual describe three potential approaches to allocating grades:
- micro-level standardisation: grade estimates are made for individual students based on the characteristics and performance of these individual students.
- meso-level standardisation: grade estimates are made at a centre/school-level. This is the approach Ofqual settled on.
- macro-level standardisation: apply a simple transformation to the centre assessed grades to standardise them, that is applied at a national level (i.e. the same transformation is applied to all centres/students in the same way).
Ultimately, the report concludes that the macro-level standardisation too heavily on the centre assessed grades being accurate and fair across schools, and also cannot satisfactorily account for differences in value-added across schools (slightly ironically, since their eventual algorithm doesn’t seem to account for this either). Likewise, Ofqual rule out the micro-level standardisation, concluding that prior attainment is not a strong enough predictor of final grade, and that this approach could end up disrupting the rank orders provided by teachers. There is also a slightly strange paragraph about the micro-level standardisation in there:
I find this an odd argument. If estimating a student’s grade from their own prior performance is profiling, then what about estimating a student’s grade from the prior performance of historic cohorts in their school?
Algorithm Validation and Accuracy
Pages 48-59 describe the process used to validate the model and determine model accuracy. This section also compares the model to two other broad categories of models: linear regression models (including some polynomial forms) and logistic regression models.
The graph below displays the overall accuracy of the different models. Approaches 1-3 are variants of the approach eventually used (called the ‘direct-centre approac’). Approaches 4-8 are different forms of linear regression, and approaches 9-11 represent different types of logistic regression. Note that approach 3 is the one that Ofqual actually used.
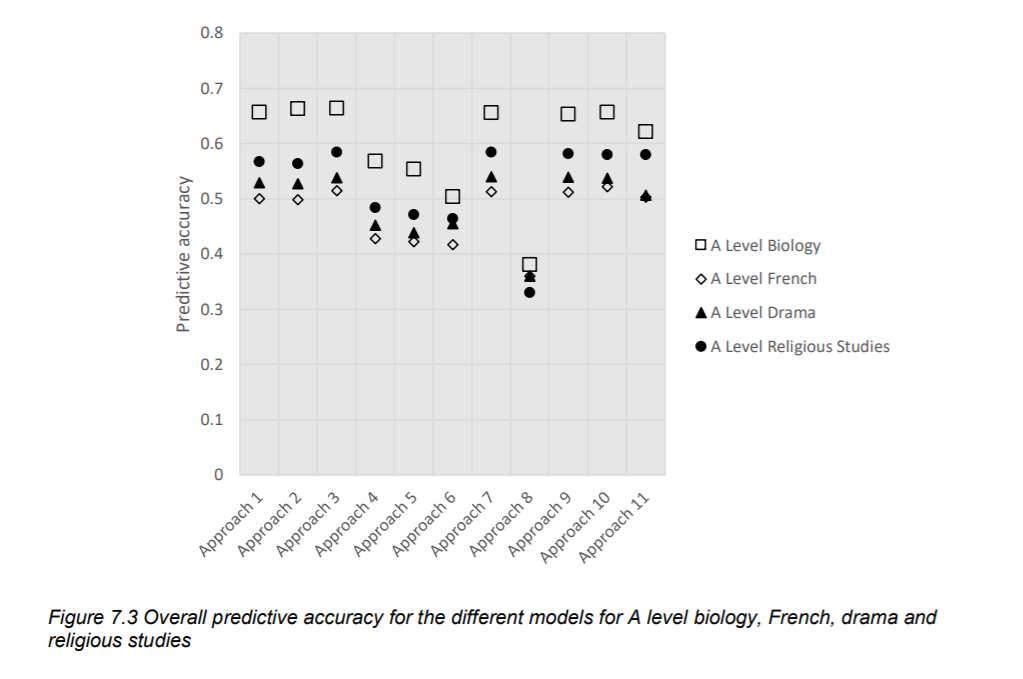
From this graph, we can see that the accuracy of the model isn’t fantastic.
I have four main issues with the validation process.
First, the general method is flawed. To assess the accuracy of the model, Ofqual use historic data from the 2019 cohort. However, there are no school-provided rankings for this cohort. Instead, Ofqual used the actual ranking of the students from their final grades. This means that an important part of their model - the use of teacher rankings - remains totally unvalidated. This is likely to lead to huge overinflation of the accuracy of the model. It also generates circularity in the model validation process - effectively, Ofqual are using actual grade data from 2019 to predict the 2019 grades…
Second, the accuracy of the final model really isn’t impressive. In a data science context, I might consider the model useful, but certainly not ready to roll out into production. It’s even more troubling given the flawed method for assessing model accuracy, since we know that this accuracy is an overestimation of the actual model accuracy.
Third, the accuracy drops off pretty steeply as a function of the size of the school:
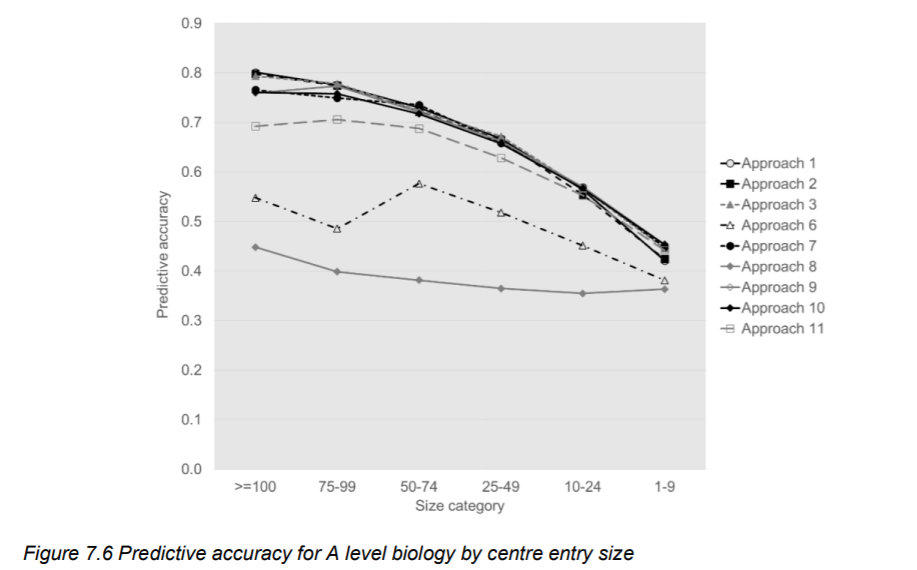
Ofqual tries to deal with this by switching to centre assessed grades for very small schools, and using a hybrid of the algorithm plus centre assessed grades for schools deemed to be ‘small’. However, we can see that accuracy drops off quite quickly as a function of school size. There are also issues with the way that Ofqual determines which schools are ‘small’ enough to warrant being treated differently. Moreover, the variable use of the algorithm depending on school size introduces unfairness into the process.
Finally, this validation really isn’t a validation of the entire algorithm. The actual, final algorithm used by Ofqual is one in which some most schools have grades allocated algorithmically, but in others the centre-assessed grades are used (or a combination of both in some cases). Ofqual do not provide any commentary on what happens to the accuracy and of the model when they add this component in. This, to me, is a gigantic oversight, and one that has serious implications when they later attempt to verify that the model does not perpetuate inequality. Indeed, on pages 61-75, Ofqual do investigate whether their algorithm unfairly biases certain groups of individuals. However, they are only looking at what happens when all students and schools are given algorthimically predicted grades. They do not investigate what happens if some schools - predominantly more well-off schools - benefit from getting the higher, CAGs instead of the algorithm. Moreover, they only run this equality analysis on a small subset of the models that they tested.
General Mistakes
Above and beyond the details of Ofqual’s approach detailed in the technical report, there are some more general mistakes that I think they made in designing the process:
- Lack of input from statistical and social science experts.
Some of these errors could have been anticipated had Ofqual sought consultation from statisticians (e.g. the Royal Statistical Society, who did offer to help).
Failure to consult experts in ethics/technology ethics. I saw no consideration of whether or not it is ethical to assign grades to students based on how their school has historically performed anywhere within the 391 page report.
Lack of input from teachers.
The task Ofqual had ahead of them was clearly an impossibly difficult task with no perfect solution. But I can see some ways that this process could have been done a bit better, and I think many of them would have involved much more consultation and communication with teachers. For instance, one option could have been to generate a predicted grade distribution for each school, then ask the school to assign students grades following this distribution. Where schools felt that the grade distribution did not match the performance of their students, there could have been a process for them to appeal and request that exceptions be made.
- Failure to set up an appeals process ahead of time. Given the accuracy of the model, it should have been little surprise that many students would seek to appeal.Yet there was no appeal process in place when results were announced. Where the algorithm-estimated grades differed substantially from centre assessed grades, Ofqual could have also allowed teachers to pre-appeal on behalf of their students.
Final Thoughts
What I’ve gone through above isn’t a comprehensive summary of the entire report, but I do have to stop somewhere(!) and I think I’ve covered a fair number of the problems with the algorithm. A number of other people have written about this topic too, which I’d encourage people to read through:
- https://constantinides.net/2020/08/15/a-levels-and-gcses-in-2020/
- https://ffteducationdatalab.org.uk/2020/08/a-level-results-2020-how-have-grades-been-calculated/
- http://thaines.com/post/alevels2020
Although A level grades have now been reverted back to CAGs, it’s important to be mindful that the problems are far from over. For a start, BTEC students are still anxiously waiting for grades, and may find themselves disadvantaged compared to A level students. Students from the 2020-2021 cohort are also likely to be disadvantaged compared to this year’s cohort. Moreover, universities are now struggling to meet their own commitments, with some unis likely to be over-subscribed while others may run into financial difficulties. Lastly, it’s worth remembering that the A level results debacle is just one of the ways that COVID-19 is impacting on our educational system. Unfortunately, it looks like students may feel the impact of the pandemic for years to come still.
DISCLAIMER: The contents of this blogpost is my interpretation of Ofqual’s technical report - my understanding of what they’ve done may not always be accurate! My hope is that by including the relevant page numbers of the report, others can also delve more easily into it and come to their own conclusions.